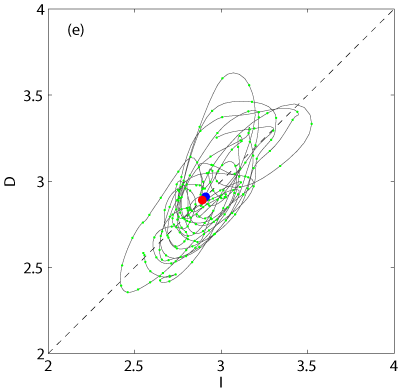
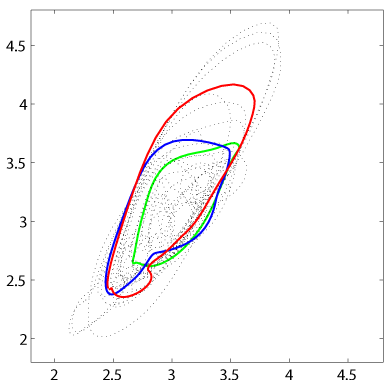
Power-dissipation visualizationPower input I vs bulk dissipation rate D of various solutions: |
|
|
|
|
These projections from
61,506 dimensions to 2 dimensions help us eliminate equilibria that
lie outside regions frequented by the turbulent trajectory as physically unimportant,
and suggest that the above periodic orbits are typical of turbulent motions.
The expression for the total kinetic energy of the fluid suggests, however, a much more versatile state space visualization. |
|
|
|
|