Upper branch unstable manifold |
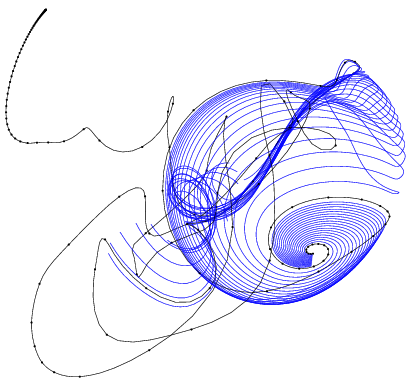 |
[Lx, Ly, Lz] = [5.51, 2, 2.51] cell, Re=400. For this cell every initial condition appears to eventually decay to the laminar solution LM, upper left corner. The dots are equidistant in time: a slowdown that signals proximity to an equilibrium is evident in the neighborhoods of the UB and LM equilibria. |
| Clearly, the eigenvectors of an equilibrium offer a natural low-dimensional basis for visualization of the dynamics in its neighborhood. But how do we put these together into a global visualization of the dynamics? | |
|
|
|